Data Analytics
Learn from industry experts.
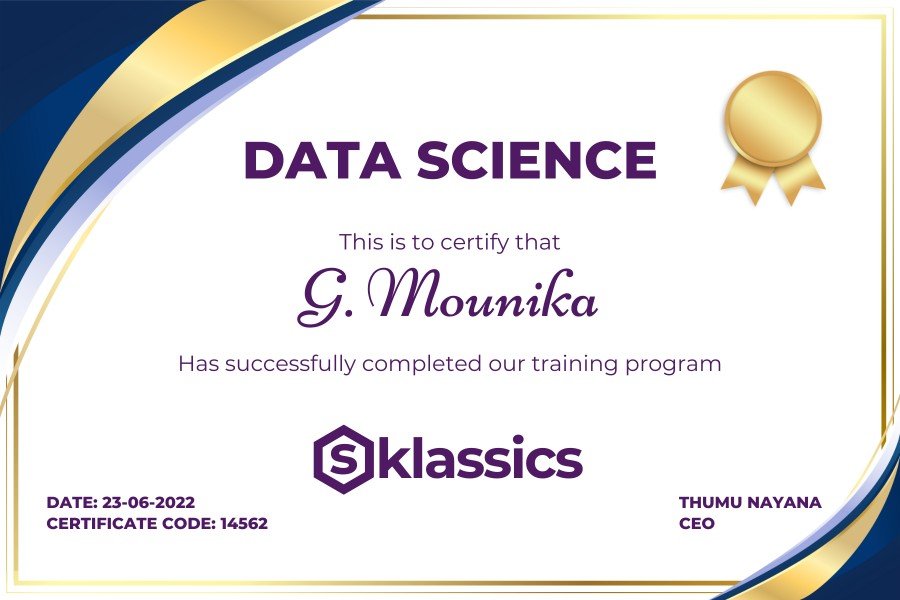
Earn a recognized certification.
Work on real-world projects.
Master tools like R, Python, Tableau, and SQL.
Overview
Dive deep into the world of Data Analytics with this comprehensive course designed to equip you with the skills to analyze, interpret, and draw actionable insights from various data sets. This course covers statistical analysis, predictive modeling, data visualization, and the use of analytics tools.
Key Highlights
- Hands-On Experience: Work with real datasets to solve analytical problems using state-of-the-art tools.
- Expert Guidance: Learn from professionals with extensive experience in data science and analytics.
- Career Advancement: Position yourself for roles in business intelligence, data analytics, and data science across various industries.
Who Can Apply?
- Professionals looking to shift into data roles.
- Business analysts aiming to enhance their analytical skills.
- Students interested in careers in data science.
Curriculum
Python Programming and Logic Building
I Will Prefer The Python Programming Language. Python Is The Best For Starting Your Programming Journey. Here Is The Roadmap Of Python For Logic Building.
Introduction And Basics
- Installation
- Python Org, Python 3
- Variables
- Print Function
- Input From User
- Data Types
- Type Conversion
- Why Python For Data Analysis And Data Science
- How To Install Anaconda
- Running Few Sample Programs Using Python
Operators
- Arithmetic Operators
- Relational Operators
- Bitwise Operators
- Logical Operators
- Assignment Operators
- Compound Operators
- Membership Operators
- Identity Operators
Conditional Statements
- If Else
- If
- Else
- El If (Else If)
- If Else Ternary Expression
While Loop
- While Loop Logic Building
- Series Based Questions
- Break
- Continue
- Nested While Loops
- Pattern-Based Questions
- Pass
- Loop Else
Lists
- List Basics
- List Operations
- List Comprehensions / Slicing
- List Methods
Strings
- String Basics
- String Literals
- String Operations
- String Comprehensions / Slicing
- String Methods
For Loops
- Range Function
- For Loop
- Nested For Loops
- Pattern-Based Questions
- Break
- Continue
- Pass
- Loop Else
Functions
- Definition
- Call
- Function Arguments
- Default Arguments
- Docstrings
- Scope
- Special Functions Lambda, Map, And Filter
- Recursion
- Functional Programming And Reference Functions
Dictionary
- Dictionaries Basics
- Operations
- Comprehensions
- Dictionaries Methods
Tuple
- Tuples Basics
- Tuples Comprehensions / Slicing
- Tuple Functions
- Tuple Methods
Set
- Sets Basics
- Sets Operations
- Union
- Intersection
- Difference And Symmetric Difference
50+ Coding Ǫuestions Practice And Assignments
Python With Data Science
- Numpy
- Pandas
- Matplotlib
- Seaborn
- Sklearn
Data Visualization Using Matplotlib And Seaborn
- Introduction To Matplotlib
- Basic Plotting
- Properties Of Plotting
- Sub Plots
- Line Plots
- Pie Chart
- Bar Graph
- Scatter Plot
- Histograms
- Box Plots
- Violin Plots
- Dist Plots
- Dis Plots
- Kde Plots
Exploratory Data Analysis (Eda) With Dataset
- Uni-Variate Analysis
- Bi-Variate Analysis
- Multi-Variate Analysis
R Programming
- Managing Data Frames With The Dplyr
- Package
- Control Structures
- Functions
- Lexical/Dynamic Scoping
- Loop Functions
- Debugging
- Data Visualization In R
- Storytelling With Data
- Principle Tenets
- Elements Of Data Visualization
- Infographics Vs Data Visualization
- Data Visualization & Graphical Functions In R
- Plotting Graphs
- Customizing Graphical Parameters To Improvise The Plots
- Various Guis
- Spatial Analysis
- Other Visualization Concepts
SQL
Introduction
- What Is Data
- Types Of Data
- What Is Database
- Types Of Databases
- What Is A Table
Operations On Table
- Creation Of Table
- Select Statement
Data Modifications
- Insert Data Into Tables
- Insert Statements & Insert Into Select Statements
- Updating Existing Data
- Deleting Data From Table
- Drop
- Truncating Tables
- Alter Statements
Constraints
- Primary Key
- Foreign Key
- Unique Key
- Not Null
- Check
- Default
Indexes
- Understanding Indexes And Their Importance
- Creating And Dropping Indexes
- Index (B Tree, Hash)
Views
- Creating Views
- Modifying Views
- Dropping Views
- Updating Data Through View
Data Retrieval
- Retrieving Data From A Single Table
- Where Clause
- Group By Clause
- Having Clause
- Order By Clause
- Limit Clause
- Case Statement
- Case Statement For Validating The Data Based On Condition
Joins
- Inner Join
- Left Join
- Right Join
- Full Join
- Cross Join
- Self-Join
Functions
- Numerical Functions
- Date Functions
- String Functions
- Aggregate Functions
Set Operator
- Union
- Intersect
- Minus
- Except
- Union All
Sub Ǫueries
- Single Row
- Multiple Row
- Scalar Row
- Correlated
- Exist
- Not Exist
- From And Select
- Where And From
Stored Procedure
- Create
- Dml
- Tcl (Commit,Roll Back, Savepoints,Acid)
- Cursor
- Execution
- Passing Parameters To Stored Procedures And Functions
- Invoking Stored Procedures And Functions
Advance Sǫl Topics
- Windows Functions
- Common Table Expression
- Recursion
- Pivot And Unpivot Operation
- Dynamic Sǫl
Power Bi
- Introduction Of Power Bi Pbi Desktop Installation Power Bi Desktop & Power Bi Service Overview
- Power Ǫuery Software Overview
- Power Pivot Software Overview
- Power View Software Overview
- Power Bi Service Overview
- Power Bi Desktop User Interface
- Building Blocks Of Power Bi
- Power Ǫuery
- Data Processing, Data Types And Filters In Power Ǫuery
- Inbuilt Column Transformation
- In Built Row Transformations
- Combine Ǫueries (Merge Ǫueries & Append Ǫueries)
- Merge Ǫueries / Join Tables
- Append Ǫueries / Union All Tables
- Ǫuery Options
- How Tab Options
- Transform Tab Options
- Add Column Tab Options
- Power Pivot
- Power Bi Data Modeling – Model View (Previously Relationship View)
- Enhancing The Data Model- Dax
- Dax Function – Categories
- Dax Text Functions
- Dax Logical Functions
- Dax Date & Time Functions
- Dax Filter Function
- Dax Math And Statistical Functions
- Dax Time Intelligence Functions
- Ǫuick Measures
- Power View
- Report View
- Visuals Interactions
- Filters In Power View
- Hierarchies And Drill-Down Reports
- Power Bi Visualizations
- Visuals For Filtering
- Visualizing Categorical Data
- Visualizing Trend Data
- Visualizing Kpi Data
- Visualizing Tabular Data
- Visualizing Geographical Data
- Grouping, Binning & Sorting
- Bookmarks, Selection Pane & Buttons
- Power Bi Services
- Adding Dataset To Power Bi Service And Creating Multiple New Reports
- Dashboards Development
Statistics And Maths
- Types Of Variables
- Nominal/Categorical
- Ordinal
- Interval/Ratio
- Continuous, Time Series
- Central Tendency
- Mean
- Median
- Mode
- Interquartile Mean
Measures And Statistical Difference
- Variance
- Correlation
- Standard Error
- Iqr
- Range
- Mean Absolute Difference
- Median Absolute Deviation
- Skewness
- Kurtosis
- Correlation And Auto Correlation And Correlation Matrix
- Correlation Ratio
Hypothesis Testing
- Chiquare
- Z Test
- T Test
- Anova
- P Value
- Beta Test
- F Score
Data Preprocessing And Feature Engineering
Methods Of Imputation
- Mean
- Median
- Mode
- B-Fill
- F-Fill
- Knn Imputation
- Random Forest Imputation
- Regressor Based Imputation
Encoding
- Label Encoding
- Dummy Encoding
- Effect Encoding
- Binary Encoding
- Hash Encoding
- Base N Encoding
Feature Scaling
- Standardization
- Normalization
Handling With Outliers
- Z-Score
- Iǫr
- Percentile
Machine Learning Algorithm’s
Python Supports N-Dimensional Arrays With Numpy. For Data In 2 Dimensions, Pandas Is The Best Library For Analysis. You Can Use Other Tools But Tools Have Drag- And-Drop Features And Limitations. Pandas Can Be Customized As Per The Need As We Can Code Depending Upon The Real-Life Problem
Supervised Learning Regression
- Linear Regression
- Polynomial Regression
- Classification
- Naïve Bayes
- Logistic Regression
- Knn
- Decision Tree Svm
Unsupervised Learning
- K-Means
- C-Means
- Pca
- K-Means
- C-Means
- Pca
Metrics
- Classification Report
- Confusion Matrix
- Accuracy Score
- Crosstab
- Fi-Score
- Precision
- Recall
- Roc Curve
- R Squared And Adjusted R Squared
- Rmse, Mse
- Evaluation Metrix
Projects
- Live Kaggle Competition
- Hands On Experience On Datasets
- End To End Unique Projects
Corporate Training
We give Corporate Employees the Training They Need to Learn & Lead
Details
Flexible Timings
36 Hours Training
Certification
24/7 Support
Why Pursue a Career in Data Analytics?
- High Demand: Data-driven decision-making is crucial across industries, increasing demand for skilled analysts.
- Lucrative Opportunities: Offers high earning potential due to critical need for data interpretation skills.
- Broad Applications: Skills applicable in various sectors like finance, healthcare, retail, and technology.

Student Success Stories
Frequently Asked Questions
What tools will I learn to use in the Data Analytics course?
Tools like R, Python, SQL, and Tableau.
How important are statistical skills in data analytics?
Fundamental to interpreting data and making predictions
Can I repeat the classes?
Yes we do provide Recordings.
Related Courses

Business Analytics
Buy for ₹20,000

Excel
Buy for ₹10,000

SQL
Buy for ₹10,000

Power BI
Buy for ₹15,000
